Atradius Atrium
Νέα πλατφόρμα διαχείρισης Ασφαλιστηρίου Συμβολαίου Πιστώσεων, εργαλείων αίτησης πιστωτικών ορίων καθώς και πρόσβασης στα Atradius Insights και Serv@Net.

 Ελλάδα
 Brazil
 Portugal
 Αυστραλία
 Αυστρία
 Βέλγιο
 Βουλγαρία
 Γαλλία
 Γερμανία
 Δανία
Δανία
 Δημοκρατία της Τσεχίας
 Ελβετία
Ελλάδα
Ελβετία
Ελλάδα
 Ηνωμένα Αραβικά Εμιράτα
 Ηνωμένες Πολιτείες
 Ηνωμένο Βασίλειο
 Ιαπωνία
 Ινδία
Ινδία
 Ιρλανδία
 Ισπανία
 Ιταλία
 Καναδάς
 Κίνα
Κίνα
 Λιθουανία
 Μεξικό
 Νέα Ζηλανδία
 Νορβηγία
 Ολλανδία
 Ουγγαρία
 Πολωνία
 Ρουμανία
 Σιγκαπούρη
 Σλοβακία
 Σλοβενία
 Σουηδία
 Τουρκία
 Φινλανδία
 Χονγκ Κονγκ

At the start of 2025, the United States maintained one of the most open trade regimes among major economies. The effective tariff rate, measured as tariff revenue relative to total imports, stood between 2% and 3%, broadly in line with the prevailing level since the liberalisation of global trade in the 1990s. Over the course of 2025 though, US trade policy shifted dramatically towards protectionism, bringing tariff levels to their highest point in generations.
In this research note, we present an overview of how the US has used tariffs as a policy tool since the start of President Trump’s second administration, setting the stage for the current tariff landscape and outlook. While there are many purported aims for these tariffs, one of the most fundamental – underpinning the US-China trade war started in 2018 – is the rebalancing of trade in the US’s favour. The remainder of the note explores how effectively tariffs have been so far in reducing the US imports. While it’s still too soon to see structural changes, we find that rerouting and the AI-investment boom are further preventing any meaningful adjustments so far.
Since January 2025, US tariff policy has moved through five distinct phases, reflecting shifts in strategy and economic impact (figure 1). Statutory tariffs refer to the rates announced in trade policy decisions. The measured effective tariff rate by contrast reflects the tariffs actually paid across all imports, incorporating exemptions, implementation delays and trade diversion. This shows a more gradual and steadier actual tariff environment than policy announcements would suggest.
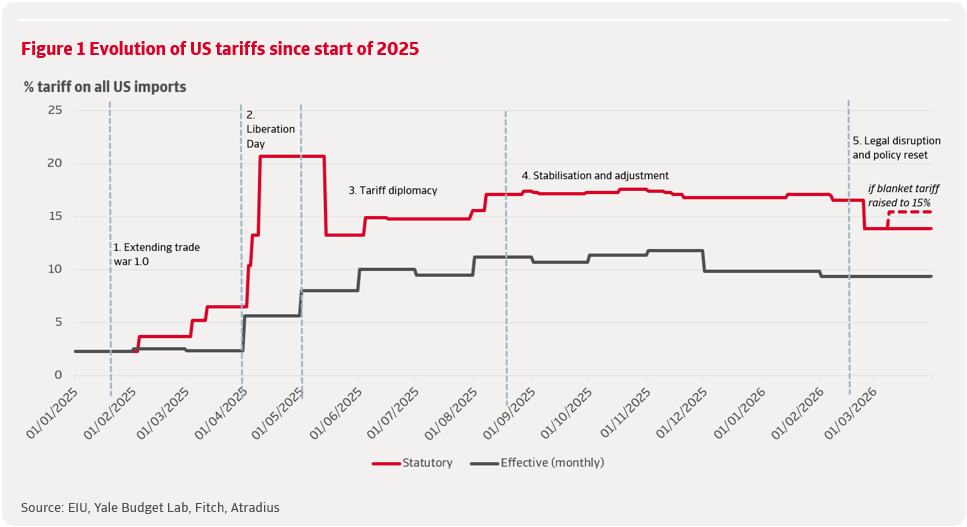
Phase 1 January-March 2025: extending trade war 1.0
The administration initially extended the tariff framework from Trump’s first term. A 10% tariff on China announced on 4 February effectively reactivated the US–China trade war, while Canada and Mexico were roped in as well with tariffs motivated by border security, fentanyl and migration. Existing sectoral tariffs, notably on steel and aluminium, were widened. This was a targeted escalation: although the statutory rate exceeded 6% by mid-March, the effective rate stayed close to 3%.
Phase 2 April 2025: Liberation Day and systemic escalation
On 2 April 2025, “Liberation Day”, the US announced the largest tariff increase in modern history. Emergency powers under the International Emergency Economic Powers Act (IEEPA) were used to introduce a universal 10% tariff and reciprocal rates of up to 50% on selected surplus countries, alongside new sector specific measures on automobiles and parts. Tariff levels returned to heights last seen in the 1930s, triggering retaliation from trade partners, market volatility and concerns over supply chains and inflation.
Phase 3 May-August 2025: tariff diplomacy
Market pressure led to a partial retreat. Reciprocal tariffs above 10% were paused for most countries, while the US negotiated deals with the EU, UK, Japan and India. The US and China also reached a truce in May. Countries without agreements faced new tariffs in August, lifting the statutory rate to 17.1% and the effective rate to 11.2%.
Phase 4 Late 2025-early 2026: stabilisation and adjustment
Following the intense negotiation phase, US trade policy entered a period of relative stability. The administration continued to use tariffs, or the threats thereof, for political leverage but the effective tariff rate stayed relatively flat. During this phase, the administration increasingly relied on targeted exemptions for sensitive industries like computers as well as food products, explicitly to ease price pressures on US consumers. This contributed to a modest fall in the effective tariff rate to 10.7% as companies shifted production and renegotiated supplier relationships.
Phase 5 Late February-March 2026: legal disruption and policy reset
A Supreme Court ruling in the end of February 2026 invalidated most emergency-based tariffs – amounting to about 75% of all US tariffs. The administration responded by introducing a temporary universal tariff under Section 122 of the 1974 Trade Act, replacing the previous country-specific tariff regime with a uniform import surcharge. While the structure has become simpler, the statutory tariff rate remains at 13.9%, six times higher than before the escalation began. Fitch estimates that this brought the effective tariff rate down only slightly to 9.4%.
The US’s complicated post-Liberation-Day tariff regime of country-specific tariffs has been replaced by a relatively simpler temporary universal tariff under Section 122. The current tariff system is characterised by:
The 10% blanket rate entered into effect on 24 February and stacks on top of existing most-favoured-nation (MFN) tariffs and earlier trade-war measures like Section 301 tariffs on Chinese goods. It also still includes exemptions for USMCA-compliant goods from Canada and Mexico and textiles from DR-CAFTA (Dominican Republic and Central America). Annex II exception product codes for strategic goods like certain critical minerals and energy products are also still in effect.
The removal of the Liberation Day country-specific tariff regime has contributed to a more level playing field for exporters to the US. But the effective tariff rate still varies across countries due to the continued presence of legacy, MFN and sectoral tariffs. Figure 2 shows snapshots of the effective tariff rate on selected economies – based on their market share and the relative magnitude of tariff changes – after Liberation Day (April 2025), before the Supreme Court ruling against IEEPA (begin February 2026) and current. The tariff rates for most countries show significant variation over the course of one year, especially China, the traditional trade target, and Brazil, for political reasons.
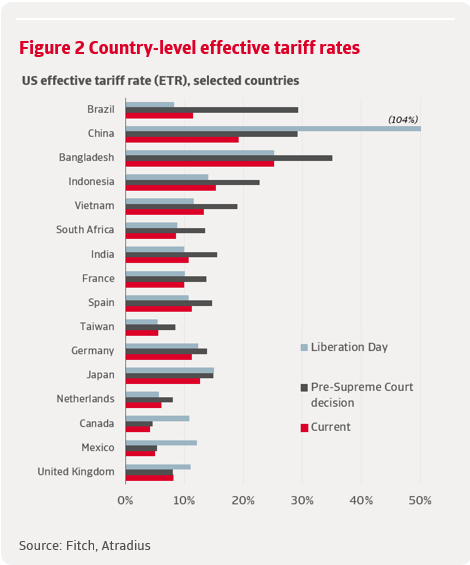
Countries that faced the highest tariffs under the reciprocal tariff system have seen the largest reductions in tariff exposure. Brazil’s effective tariff rate fell from 29.3% to 11.4% while China’s decreased from 29.2% to 19.2%. Other Asian countries like Bangladesh, Indonesia and Vietnam were also the main beneficiaries. Bangladesh still stands out with a high tariff rate relative to peers (25.2%) since it exports primarily garments and textiles which are subject to high MFN tariffs.
For many countries, especially US allies, the transition to Section 122 has had limited effect. Canada and Mexico have seen very little change in the duties for their US exports since the USMCA exemption was maintained. EU countries like Germany and France have seen minor reductions while the UK’s tariff rate hardly budged. This is because they had already negotiated trade deals that brought their tariffs close to the current baseline. This is also the case for Japan and India who also reached trade and investment deals with the US through the tariff diplomacy phase.
Overall, the new tariff structure is simpler but it has reignited significant uncertainty surrounding trade with the US. Most importantly, it is only temporary. It is scheduled to remain in force for 150 days (roughly 24 July) – the duration allowed under Section 122, unless Congress extends it. Moreover, things may still change in the meantime: President Trump has also threatened to raise the blanket 10% tariff rate to 15%, which would raise the overall statutory tariff rate to 15.1% from 13.9% currently.
Washington is investigating the use of other trade authorities to effectively recreate the tariff scheme invalidated by the Supreme Court. One such investigation is into a new set of Section 301 investigations focusing on “structural excess capacity and production” across a range of manufacturing sectors like steel, aluminium, autos and electronics. This concerns 16 economies including China, the EU, Mexico and several Asian exporters. The Trump administration directly followed that announcement with another sweeping investigation into 60 economies including Canada, China, the EU and UK concerning their trade policies on goods made with forced labour.
The policy uncertainty and accelerated investigations have raised frustration and concern among trading partners. For instance, the EU is concerned that these unilateral moves may undermine the trade deal reached last July.
The sharp escalation, subsequent stabilisation and recent legal reset in US trade policy have now begun to show through in the data. One year after Liberation Day, tariffs are clearly reshaping trade patterns, but the outcomes diverge from one of the administration’s core objectives of reducing the US trade deficit. Rather than a broad-based contraction in imports, the dominant effects so far have been frontloading, price effects and a reconfiguration of trade partners.
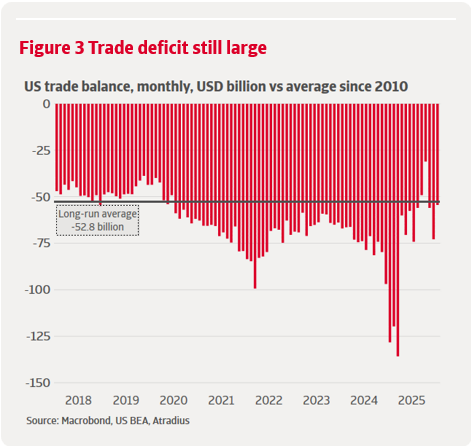
Despite the unprecedented rise in effective tariff rates since early 2025, the overall US trade deficit has not narrowed in any sustained way. The deficit has been volatile, reflecting the sequencing of tariff announcements and pauses described above, but there is little evidence of a structural correction. Imports increased sharply in early 2025 as firms aggressively frontloaded shipments ahead of announced tariffs. This also had the opposite effect of compressing imports in the following months as inventories were run down. As of January 2026, the overall trade deficit was USD 54.5 billion, roughly in line with its long-run average (figure 3).
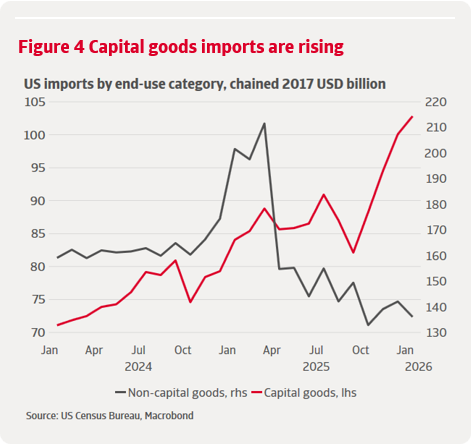
The persistence of US domestic demand has limited the impact of higher trade barriers on aggregate import volumes. This is especially visible when we look at the composition of imports. The AI-driven investment boom has sustained strong demand for imports of high-tech goods associated with AI and data centres despite higher prices. Capital goods imports – including computers, semiconductors and accessories – have been rising strongly through the year. In January 2026, capital goods imports were 16% higher than the 2025 average while non-capital goods imports were trending downward after a front-loading surge ahead of Liberation Day (figure 4).
Price effects have further diluted the impact on the nominal trade balance. With higher effective tariff rates came markedly higher customs duties paid by US importers. The New York Fed estimates that 93% of the tariff costs were absorbed by US importers in 2025 rather than passed back to foreign exporters . Higher import prices inflate nominal import values even when volumes soften, limiting potential improvement in the nominal trade deficit.
The trade deficit remains historically wide and volatile, reflecting other underlying trends like price effects and the AI investment boom as well as frontloading. Therefore it’s too soon to conclude that the tariffs have been ineffective in narrowing the trade deficit, but the experience so far is in line with empirical research. IMF research estimates small and insignificant effects of higher tariffs on the trade balance in both the short term and long term . The limited short-term impact is primarily through price effects whereas the impact on volume is small and delayed, requiring years for companies to reconfigure supply chains. Research from the Federal Reserve on the 2018-19 tariffs also finds import quantity effects only emerged after 12-18 months, concentrated in the targeted sectors and largely offset by substitution from other suppliers, leaving the aggregate US deficit unchanged . Looking back at the evolution of the US trade deficit in figure 3, the lack of sustained narrowing reinforces the view that any structural correction should take years to be visible.
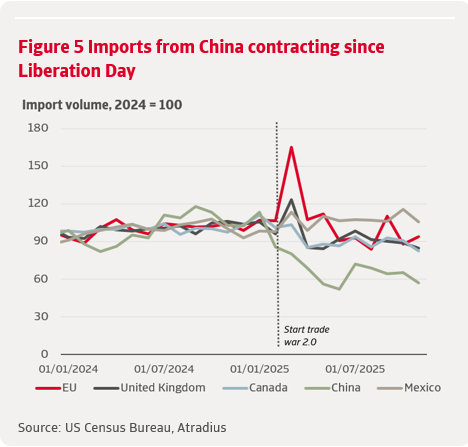
At the bilateral level, trade data more clearly reflect the impacts of the tariff regime. Imports from China have continued to contract sharply since Liberation Day, accelerating the decoupling that began under the first Trump administration . In contrast, imports from most other major partners have been more volatile but far less compressed. Mexico stands out with imports now around 5% higher than in 2024, reflecting USMCA exemptions and its role as a key alternative production base (figure 5).
The dominant adjustment has been trade diversion rather than import substitution. This is in line with expectations given the stickiness of global value chains. Recreating domestic supplier networks is a major investment that requires significant, persistent shocks, making diversion of trade the path of least resistance in the short to medium term . As firms responded to the layered tariff structure, supply chains were rerouted to minimise exposure while maintaining overseas sourcing. Other Asian economies and Mexico gained US market share as Chinese exports were displaced or channelled through third countries (figure 6).
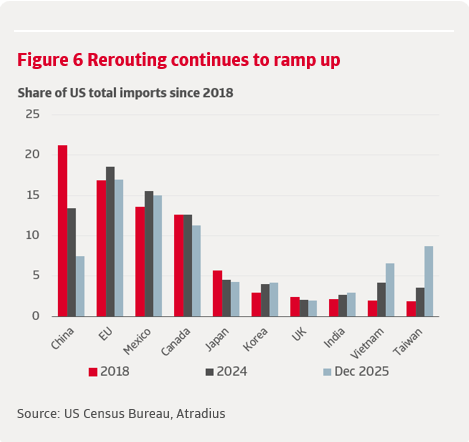
This pattern mirrors the experience since 2018 and highlights a key limitation of the broadening of tariffs under trade war 2.0. While direct US‑China trade has fallen sharply, the global footprint of Chinese manufacturing has allowed exports to re-enter the US indirectly, undermining the effectiveness of tariffs in reducing overall import dependence. China accounted for over 20% of US imports in 2018 which was already contained to 13.4% by 2024. Now a year after Liberation Day, that share is only 7.5%, 6 percentage points lower. This has been more than offset by a 2.4ppt increase in Vietnam’s market share to 6.7% and Taiwan’s by 5.2ppt to 8.8%.
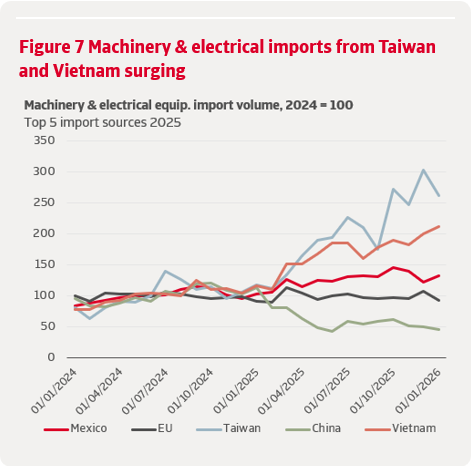
This reconfiguration is most visible in the machinery and electrical equipment sector, which accounts for around one‑third of total US imports. The sector overlaps closely with the capital goods dynamics discussed above, covering industrial machinery, IT hardware for production and electrical equipment for factories and infrastructure. At the same time, it also includes non‑capital goods such as consumer electronics, making it a useful bridge between investment demand and consumer imports.
Machinery and electrical equipment have been the main source of import resilience since the escalation of the trade war, with volumes up around 25% since 2024. Imports from China, previously the dominant supplier, have fallen to less than half their 2024 level. This decline has been more than offset by rising imports from other Asian economies, most notably Taiwan, whose sectoral exports to the US have nearly tripled, and Vietnam, where they have doubled. Mexico has emerged as the largest supplier overall, with imports now around 32% above their 2024 level, reflecting both tariff exemptions and supply‑chain re‑routing (figure 7).
Overall, the evidence suggests that the evolution of US trade policy since Trump 2.0 has reshaped trade patterns but has not delivered a durable improvement in the trade balance. Higher tariffs have altered sourcing decisions, accelerated decoupling from China and reinforced trade diversion towards other Asian partners and Mexico, particularly in machinery and electrical equipment, the largest and most resilient import category. With tariffs now embedded at a much higher level, exemptions playing a growing role and the legal basis of the current regime still uncertain, further adjustment is likely to come through supply-chain adjustments and demand resilience rather than a sustained retrenchment of US imports. For firms worldwide, the unresolved and temporary nature of the tariff regime continues to favour incremental rerouting over meaningful shifts in long‑term production and investment strategies.
Αίτηση επανάκλησης
Νομική ειδοποίηση
